Visualization#
For the full technical reference see wulfric.PlotlyEngine.
Visualization in wulfric is implemented with Plotly.
Visualization backend#
First, one need to create an instance of the plotting engine as
>>> import wulfric
>>> pe = wulfric.PlotlyEngine()
The creation of the plotting engine can take one optional argument: fig:
>>> from plotly import graph_objects as go
>>> fig = go.Figure()
>>> pe = wulfric.PlotlyEngine(fig=fig)
After plotting the figure can be either displayed
>>> pe.show(width=1000, height=800)
or saved as an .html file
>>> pe.save(output_name="wulfric-plot.html", width=1000, height=800)
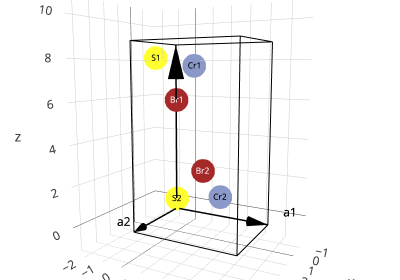
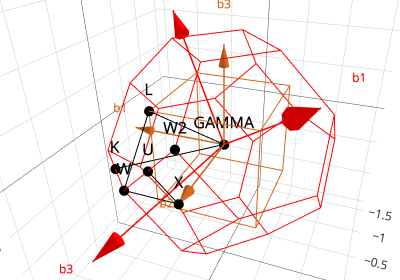
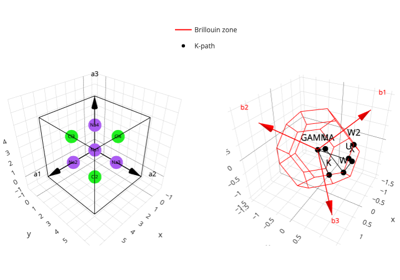
wulfric.PlotlyEngine has a number of methods that can be used to plot cell, atoms,
lattice and so on. Check examples to get a feeling on what is implemented